A company can generate more sales every month and still struggle to make money. Revenue might be increasing while operating costs rise faster, customers leave, or cash becomes difficult to manage. Without examining the complete business, these warning signs can remain hidden.
Understanding how to analyze a business helps owners, managers, entrepreneurs, and investors evaluate performance, identify risks, and make better decisions. The process combines financial analysis, customer research, operational evaluation, market research, and strategic planning.
You do not need advanced financial expertise to begin. What matters is asking the right questions, collecting reliable information, and knowing how to interpret the results.
Quick Answer: How Do You Analyze a Business?
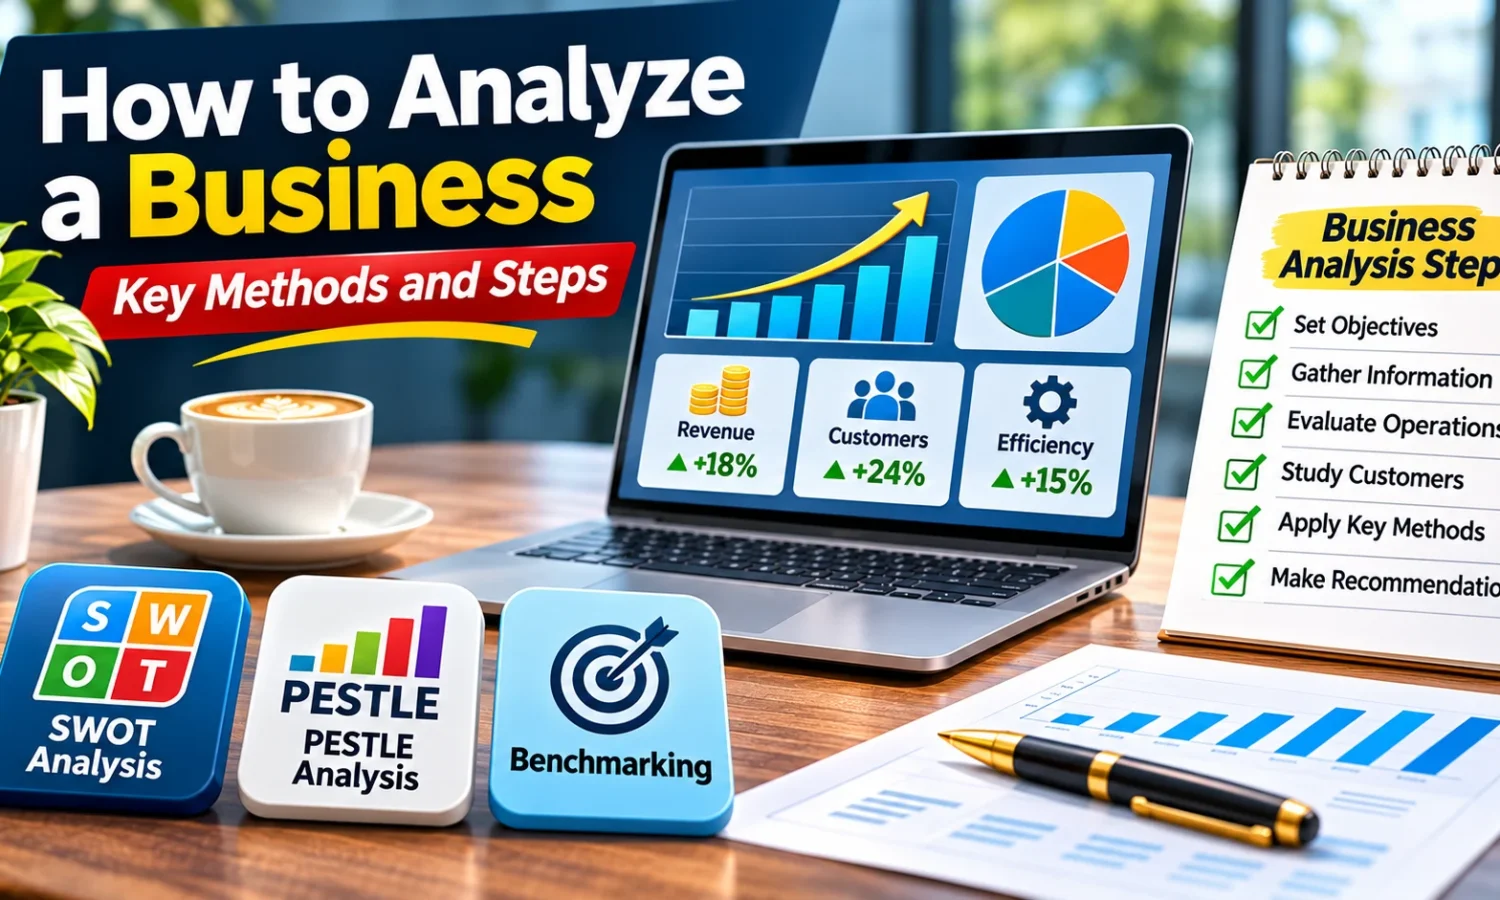
To evaluate a business effectively, follow these eight steps:
- Define your objectives and the questions you want to answer.
- Gather financial, operational, customer, and market information.
- Examine financial performance and cash flow.
- Evaluate business operations and efficiency.
- Study customers, products, and market demand.
- Research competitors and industry conditions.
- Apply business analysis frameworks to identify strengths, weaknesses, and risks.
- Turn your findings into an actionable improvement plan.
These steps help you move beyond surface-level figures and understand what drives a company’s results.
What Is Business Analysis?
Business analysis is the practice of identifying business needs, examining existing conditions, and recommending changes that deliver value.
The International Institute of Business Analysis (IIBA) describes the discipline as a structured way to understand organizational needs and support change.
In practical business evaluation, it involves investigating how a company earns revenue, manages expenses, serves customers, competes in its market, and achieves its objectives.
When people search for ways to analyse a business, they often want answers to questions such as:
- Is the company financially healthy?
- What products or services generate the most profit?
- Why are customers leaving?
- Are operating expenses too high?
- What advantages do competitors have?
- Which changes could improve performance?
These questions require looking at several connected areas rather than relying on a single metric.

Business Analysis vs. Competitor Analysis
Although the terms are sometimes confused, they describe different scopes of work.
| Business analysis | Competitor analysis |
|---|---|
| Evaluates business needs, performance, processes, and opportunities | Examines competing companies and their market strategies |
| Uses internal and external information | Relies heavily on external market information |
| Covers finances, operations, customers, risks, and strategic decisions | Covers pricing, products, positioning, marketing, and competitors’ strengths |
| Supports organizational improvement and change | Supports competitive positioning and market decisions |
Competitor research is therefore one useful component of a broader business evaluation.
Why Is Analyzing a Business Important?
A structured evaluation provides information that can improve both day-to-day decisions and long-term planning.
1. Understand financial health
Sales figures alone cannot show whether a business is profitable or has sufficient cash to pay its obligations. Reviewing financial statements reveals how much money the company earns, spends, owes, and retains.
2. Identify operational problems
Slow processes, repeated mistakes, unnecessary spending, and poor inventory management can reduce profitability. An operational review helps identify where resources are being wasted.
3. Understand customers and market demand
Customer feedback, buying behavior, and sales trends can reveal which products people value and which areas need improvement.
4. Recognize risks and opportunities
Market changes, emerging competitors, supplier problems, new technologies, and changing customer preferences may create threats or opportunities.
5. Make evidence-based decisions
Instead of expanding, hiring, or increasing advertising spending based on assumptions, managers can use relevant information to evaluate likely costs, benefits, and risks. The goal is not simply to produce a detailed report. It is to understand what is happening, why it is happening, and what should happen next.

How to Analyze a Business: 8 Practical Steps
The following process works for small businesses, startups, established companies, and many business case-study assignments. The available information and depth of analysis will vary depending on the organization.
Step 1: Define Your Business Analysis Objectives
Before gathering information, determine what you want to discover. An analysis intended to improve profitability will require different information from one designed to evaluate a potential acquisition or launch a new product. Begin with a clearly defined business question.
Examples include:
- Why has the net profit margin decreased?
- Which products generate the highest returns?
- Should the company open another location?
- Why have customer complaints increased?
- Is the business financially prepared for expansion?
Next, establish the scope of your evaluation.
Decide which departments, locations, products, and reporting periods you will examine. For example, you might analyze the previous 12 months of sales and compare the results with the preceding year.
Practical example: A small retailer discovers that revenue has increased, but monthly profit has remained unchanged. Its objective might be to identify which costs are preventing revenue growth from translating into higher profit.
A focused question makes it easier to select relevant data and avoid unnecessary research.
Step 2: Gather Reliable Business Information
A useful assessment depends on the quality of the information collected.
Start with internal company records and supplement them with credible external research.
| Information type | Examples | What it helps reveal |
|---|---|---|
| Financial records | Income statements, balance sheets, cash flow reports | Profitability and financial stability |
| Sales information | Transactions, product sales, average order value | Revenue patterns |
| Customer information | Surveys, complaints, retention records | Satisfaction and loyalty |
| Operational records | Production times, inventory, staffing | Efficiency and costs |
| Market information | Industry reports, customer trends | Demand and growth opportunities |
| Competitor information | Pricing, products, public reviews | Competitive position |
For publicly traded companies, annual reports and regulatory filings can provide detailed financial and operational information. For privately owned companies, complete financial records may not be publicly available. In that case, any assessment based on external information should clearly acknowledge its limitations.
Data quality checklist:
- Confirm that financial figures cover comparable periods.
- Check whether amounts use the same currency and accounting basis.
- Distinguish verified figures from estimates.
- Account for seasonal fluctuations.
- Investigate unusual or missing data.
- Record where important information came from.
A comparison between a full year’s sales and a single quarter’s sales, for example, would be misleading unless adjusted appropriately.

Step 3: Examine the Company’s Financial Performance
Financial analysis is one of the most important parts of evaluating a company. Begin with three essential financial statements.
Income statement
The income statement shows revenue, expenses, and profit over a specific period. It helps determine whether the company is earning more than it spends under applicable accounting rules.
Balance sheet
A balance sheet reports assets, liabilities, and equity at a particular date. It helps assess what the business owns, what it owes, and its financial position.
Cash flow statement
The cash flow statement shows how cash enters and leaves the organization through operating, investing, and financing activities. A business can report accounting profit while experiencing cash shortages, particularly when customers have not yet paid or significant amounts are tied up in inventory.
Key Financial Ratios to Calculate
| Metric | Formula | What it measures |
|---|---|---|
| Revenue growth | (Current revenue − Previous revenue) ÷ Previous revenue × 100 | Change in sales |
| Gross profit margin | (Revenue − Cost of goods sold) ÷ Revenue × 100 | Profitability before other expenses |
| Net profit margin | Net profit ÷ Revenue × 100 | Profit remaining after expenses |
| Current ratio | Current assets ÷ Current liabilities | Short-term liquidity |
| Debt-to-equity ratio | Total debt ÷ Total equity | Financial leverage |
These metrics must be interpreted in context. There is no single ideal profit margin or current ratio that applies to every industry.
For example, suppose a company generates $200,000 in annual revenue and earns $24,000 in net profit.
Net profit margin = ($24,000 ÷ $200,000) × 100 = 12%.
This means the business earns $0.12 in net profit for every dollar of revenue. The next question is whether that margin is improving, declining, or appropriate for its business model. Compare financial results with previous periods and relevant industry benchmarks before reaching a conclusion.

Step 4: Evaluate Business Operations and Efficiency
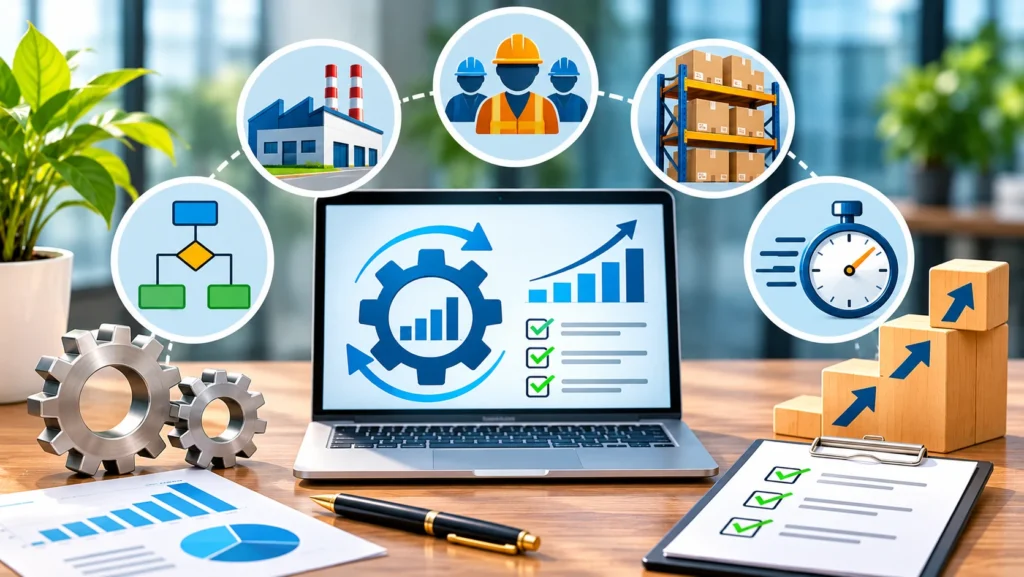
Financial statements reveal outcomes, but they do not always explain the operational causes behind those outcomes. Operational analysis examines how efficiently a business converts resources into products or services.
Review areas such as:
- Employee productivity and workload.
- Production and delivery times.
- Inventory shortages and excess stock.
- Supplier reliability.
- Product defects and returns.
- Customer service response times.
- Administrative processes and technology.
For example, an online retailer might have strong customer demand but lose potential sales because orders take too long to fulfill. A service business might have a high volume of appointments but low profitability because employees spend excessive time on administrative work. To investigate these situations, map the workflow from beginning to end.
Identify where work slows down, where mistakes happen, and which tasks consume unnecessary time. Then measure the effect. If an operational change reduces average order processing time from 30 minutes to 20 minutes, that represents a one-third reduction in processing time. However, the business should also check whether service quality has been maintained. Efficiency improvements are valuable only when they support the organization’s broader goals.
Step 5: Study Customers, Products, and Market Demand
A financially stable company can still face serious challenges if its products no longer meet customer expectations. Customer and market analysis helps explain why people buy, why they stop buying, and whether demand is changing. Start by examining your target audience.
Consider customer demographics, purchasing needs, budgets, preferred channels, and reasons for choosing one provider over another. Then evaluate product or service performance.
Useful questions include:
- Which products generate the highest revenue?
- Which products deliver the strongest contribution margins?
- What percentage of customers make repeat purchases?
- What complaints appear most frequently?
- Are customers sensitive to price changes?
- Which products are experiencing declining demand?
Customer Metrics Worth Monitoring
| Metric | Purpose |
|---|---|
| Customer retention rate | Measures how well the business keeps existing customers |
| Average order value | Shows average spending per order |
| Customer acquisition cost | Measures the cost of acquiring customers |
| Conversion rate | Measures how often a defined action becomes a sale or lead |
| Customer satisfaction | Helps identify service and product problems |
Customer feedback is especially useful when combined with transaction data. For example, falling repeat purchases might indicate a problem with quality, pricing, delivery, or customer experience. Interviews and surveys can help determine the underlying cause. Avoid assuming that one metric proves a particular explanation. Investigate alternative causes before recommending changes.

Step 6: Research Competitors and Industry Conditions
Competitor analysis helps determine how a business compares with alternative providers in the market. Start by identifying two categories of competitors.
Direct competitors offer similar products or services to a comparable customer group.
Indirect competitors satisfy the same underlying customer need through a different product, service, or business model.
For example, a neighborhood coffee shop competes directly with nearby cafés. Convenience stores selling takeaway coffee may represent indirect competition.
Select three to five relevant businesses for an initial comparison.
Research their products, pricing, customer experience, marketing, positioning, and publicly observable strengths.
Example Competitor Comparison
| Factor | Your business | Competitor A | Competitor B |
|---|---|---|---|
| Pricing | Moderate | Low | Premium |
| Product range | Medium | Wide | Specialized |
| Customer service | Personalized | Standardized | Premium |
| Online ordering | Available | Available | Limited |
| Delivery | Limited area | Wide area | Not available |
Illustrative comparison only.
This table helps reveal possible opportunities.
Perhaps competitors have broader product selections, but customers consistently complain about poor support. Your business might differentiate itself through faster, more personalized service.
However, competitor weaknesses do not automatically guarantee demand. Validate opportunities with customer research before investing.
The U.S. Small Business Administration recommends examining competitors, market conditions, barriers to entry, and potential sources of competitive advantage when conducting business research.
Step 7: Apply Business Analysis Frameworks
Analysing business performance becomes more structured when you use recognized analytical frameworks. Different methods answer different questions. You do not need to apply every framework to every organization.
SWOT Analysis:
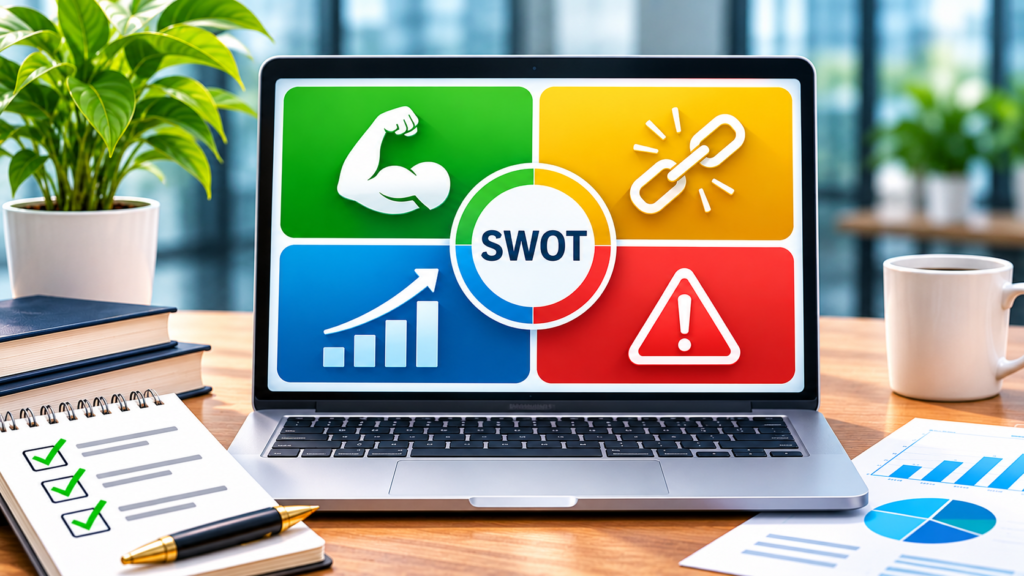
SWOT evaluates internal strengths and weaknesses alongside external opportunities and threats.
| Strengths | Weaknesses |
|---|---|
| Loyal customers | Limited marketing budget |
| Experienced employees | High operating expenses |
| Strong product quality | Slow order fulfillment |
| Opportunities | Threats |
|---|---|
| Growing online demand | New market entrants |
| New customer segments | Increasing supplier costs |
| Potential partnerships | Changing customer preferences |
The value of SWOT comes from the evidence behind each observation.
For example, describing customer loyalty as a strength is more meaningful when supported by repeat-purchase data.
After completing the framework, prioritize the findings and identify suitable actions.
PESTLE Analysis:
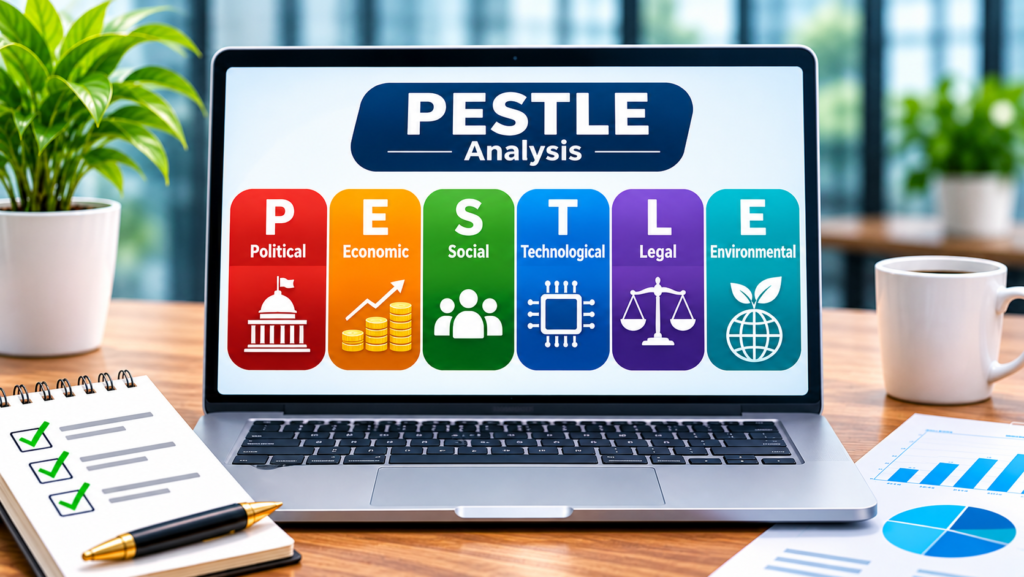
PESTLE examines six categories of external influence.
- Political: Government policy, trade rules, and political conditions.
- Economic: Inflation, interest rates, employment, and consumer spending.
- Social: Population trends, lifestyles, and customer expectations.
- Technological: Automation, digital platforms, and technological change.
- Legal: Applicable employment, consumer protection, privacy, and industry laws.
- Environmental: Resource availability, sustainability pressures, and environmental conditions.
For example, a food business might use PESTLE to assess rising ingredient prices, changing consumer preferences, food safety requirements, and opportunities from online ordering.
PESTLE is particularly useful when considering expansion into a new market or evaluating external risks.
Porter’s Five Forces:
Porter’s Five Forces examines the competitive pressures affecting an industry. The five forces are competitive rivalry, threat of new entrants, threat of substitutes, bargaining power of suppliers, and bargaining power of buyers. A business with many similar competitors, powerful suppliers, and price-sensitive customers may struggle to protect its margins. This framework helps explain industry profitability and whether a market offers attractive opportunities.
Benchmarking:
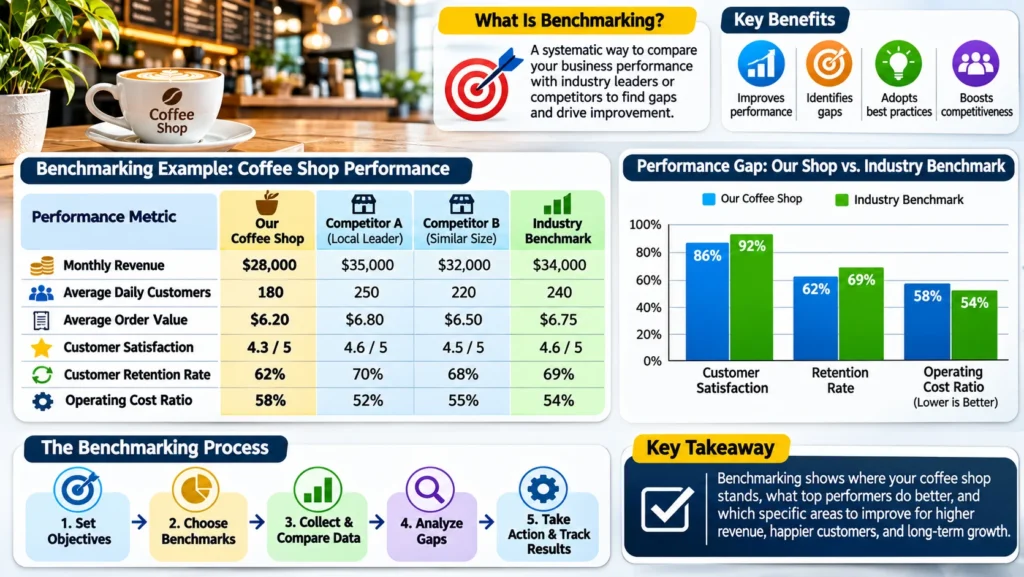
Benchmarking compares performance against earlier results, similar businesses, or relevant industry standards.
You can compare:
- Profit margins.
- Delivery times.
- Customer retention.
- Sales growth.
- Inventory turnover.
- Service quality.
Use comparable definitions and periods. A small local company should not assume that metrics from a much larger business are directly applicable.
Step 8: Interpret Findings and Create an Action Plan
Completing an assessment is only useful if the findings lead to decisions. Start by separating observations from explanations.
For example:
Observation: Operating expenses increased by 15%.
Possible explanations: Higher labor costs, increased supplier prices, additional marketing spending, or inefficient processes.
Next step: Examine detailed expense records to determine which categories contributed most to the increase. Once the causes are understood, convert the findings into actions.
A practical method is the Evidence–Impact–Action framework.
| Component | Question |
|---|---|
| Evidence | What reliable information supports the finding? |
| Impact | How does the issue affect cost, revenue, customers, or risk? |
| Action | What specific improvement should be tested or implemented? |
| Owner | Who is responsible? |
| Review | When and how will the result be measured? |
Prioritize actions using expected impact, cost, urgency, confidence in the evidence, and implementation difficulty.
A useful business report should summarize the company’s current position, significant findings, key risks, recommended improvements, and the metrics that will determine whether those improvements work.
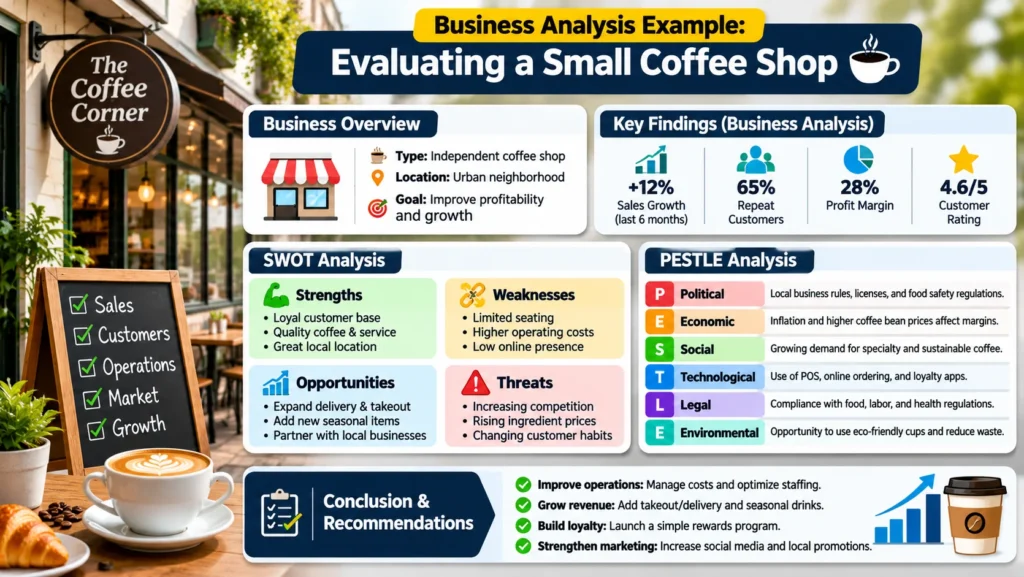
Business Analysis Example: Evaluating a Small Coffee Shop
Consider a fictional neighborhood business called Bean Street Café.
The owner notices that monthly sales are growing, but net profit is not improving.
To investigate the problem, the owner compares two months of financial results.
Step 1: Review Financial Performance
| Metric | Previous month | Current month |
|---|---|---|
| Revenue | $27,000 | $30,000 |
| Cost of goods sold | $9,000 | $10,500 |
| Other operating expenses | $13,000 | $14,500 |
| Interest and tax expenses | $2,000 | $2,000 |
| Net profit | $3,000 | $3,000 |
| Net profit margin | 11.1% | 10.0% |
All figures are hypothetical and assume the listed categories include the relevant expenses for each month.
Revenue increased by approximately 11.1%, but net profit remained at $3,000. The profit margin decreased from approximately 11.1% to 10%. This shows why revenue growth alone is not sufficient to judge performance.
Step 2: Investigate the Costs
The owner examines purchase records and discovers that ingredients and packaging now represent a larger share of sales. Cost of goods sold increased from 33.3% to 35% of revenue.
The owner also investigates staff schedules, inventory waste, and peak-hour service times to identify why operating expenses increased.
Step 3: Evaluate Market Position
Customer interviews and competitor research suggest that customers value the café’s personalized service, but some are dissatisfied with waiting times. The nearby competition includes a lower-priced takeaway chain and a premium café with a wider food selection. The business therefore needs to improve efficiency without losing its strongest competitive advantage: customer experience.
Step 4: Create an Improvement Plan
The owner prepares the following illustrative 90-day plan.
| Timeline | Action | Measurement |
|---|---|---|
| Days 1–30 | Review supplier prices and ingredient waste | Cost of goods sold percentage |
| Days 31–60 | Test improved peak-hour staffing | Service time and labor costs |
| Days 61–90 | Evaluate menu profitability and customer response | Product margins, sales and complaints |
The owner also reviews cash flow separately to confirm that planned improvements are financially manageable.
What Does This Example Demonstrate?
The business does not necessarily need more customers or higher advertising expenditure. Its immediate challenge is converting existing sales into better profitability while maintaining service quality.
The analysis identifies a measurable problem, investigates possible causes, and creates a plan that can be tested.
That is the practical value of a structured evaluation.
Which Business Analysis Method Should You Use?
The best method depends on the question you are trying to answer.
| Business question | Recommended method |
|---|---|
| Is the company profitable? | Financial statement and ratio analysis |
| Why are costs increasing? | Cost analysis and process mapping |
| How does the business compare with competitors? | Competitor analysis and benchmarking |
| What are the main strengths and risks? | SWOT analysis |
| How might external conditions affect performance? | PESTLE analysis |
| Is the industry attractive? | Porter’s Five Forces |
| Why are customers leaving? | Customer feedback, cohort analysis and root-cause investigation |
| Which improvement should be prioritized? | Impact, cost and feasibility assessment |
Combining methods often produces a more complete assessment than relying on one framework. For example, financial analysis might reveal declining margins, operational analysis might explain rising costs, and competitor research might show why increasing prices would be difficult.
Common Mistakes to Avoid When Evaluating a Business
Even detailed research can lead to weak conclusions if the information is interpreted incorrectly.
Focusing Only on Revenue
High sales do not necessarily mean high profitability. Evaluate costs, margins, working capital, and cash flow alongside revenue.
Using Outdated or Incomplete Information
Industry conditions and customer behavior change over time. Check the reporting period and credibility of the information before using it.
Ignoring Customer Feedback
Financial figures can show that performance has changed, but customer feedback may explain why.
Comparing Businesses That Are Not Similar
Companies may have different business models, accounting policies, customer segments, and cost structures. Adjust comparisons where possible.
Treating Assumptions as Facts
A hypothesis about declining sales should be tested against actual data. Clearly identify what has been verified and what remains uncertain.
Collecting Data Without Taking Action
Long reports provide limited value when they do not contain clear recommendations, responsibilities, deadlines, and measurable outcomes.
Simple Business Analysis Checklist
Use this checklist before completing your evaluation.
- Define the main business question and scope.
- Collect recent and reliable business information.
- Review revenue, expenses, profit, and cash flow.
- Evaluate assets, liabilities, and financial risks.
- Identify operational inefficiencies.
- Analyze customer needs and product performance.
- Compare relevant direct and indirect competitors.
- Examine industry conditions and external risks.
- Apply suitable strategic frameworks.
- Separate verified findings from assumptions.
- Prioritize recommended improvements.
- Assign responsibilities and performance measures.
- Establish a schedule for reviewing progress.
The checklist can be adapted for a small business, startup, established organization, or academic case study.
Frequently Asked Questions
What Are the Main Steps in Analyzing a Business?
The main steps are defining objectives, collecting information, evaluating finances, examining operations, studying customers, researching competitors, applying analytical frameworks, and developing an action plan. Each step contributes a different part of the overall business assessment.
What Are the Most Common Business Analysis Methods?
Common methods include SWOT analysis, PESTLE analysis, Porter’s Five Forces, financial ratio analysis, benchmarking, customer research, and process analysis. The appropriate method depends on the business question and available evidence.
How Do You Analyze a Small Business?
Start with financial statements, sales records, operating expenses, customer feedback, and local competitors. Calculate a few important KPIs, identify the largest problems, and recommend achievable improvements. Small businesses do not necessarily need expensive analytical software.
Can You Analyze a Business Without Financial Statements?
You can conduct a limited external assessment using public information, customer reviews, market research, product comparisons, and observed business activity. However, without reliable financial records, you cannot confidently determine profitability, liquidity, or overall financial health.
What Is the Difference Between SWOT Analysis and Business Analysis?
SWOT is a specific framework for organizing strengths, weaknesses, opportunities, and threats. Business analysis is a much broader discipline that can include financial evaluation, operational investigation, requirements analysis, strategic planning, and recommendations for organizational change.
How Often Should a Business Be Analyzed?
The appropriate schedule depends on business size and risk. Many businesses benefit from monitoring important KPIs weekly or monthly, conducting broader performance reviews quarterly, and completing a more comprehensive strategic assessment annually or when major changes occur.
What Tools Can Help Beginners Analyze a Business?
Beginners can use Microsoft Excel or Google Sheets to organize records and calculate ratios. Accounting software can help prepare financial reports, while customer surveys, website analytics, CRM records, and market research resources can provide additional insight. Choose tools according to the question rather than collecting more data than necessary.
Final Thoughts
A successful business evaluation connects financial results, operational performance, customer behavior, and market conditions to practical decisions.
The most important skill is not memorizing every framework or calculating dozens of financial ratios. It is knowing what question to ask, which evidence to examine, and how to turn findings into meaningful improvements.
Start with a clear objective, evaluate the available information, compare results over time, investigate underlying causes, and create a measurable action plan.
The purpose of business analysis is not simply to understand how a company performed in the past. It is to make better decisions about what the company should do next.